End of Life Tyres(ELT)
1. Amount of ELT Generated and Effectively Utilized
Processing flow of ELTs
(1) Amount of ELT generated
The amount of ELT generated in Japan in 2024 was 89 million tyres, including tyres replaced and those from scrapped vehicles. This is a decrease of 1 million units from the previous year.
①
Amount of ELT generated by replacing tyres
The amount of ELT generated by replacing tyres was 78 million tyres. Since the sales of replacement tyres remained unchanged from the previous year, the amount of ELT generated also remained at the same level as the previous year.
②
Amount of ELT generated from scrapped vehicles
The amount of ELT generated from scrapped vehicles was 11 million units. The number of scrapped vehicles decreased by 4.5% from the previous year to 2.608 million, marking the lowest level in the past 10 years. As a result, the amount of ELT generated also declined by approximately 1 million tyres compared to the previous year.
Trends in ELT generation
Tyres: millions
| 2021 | 2022 | 2023 | 2024 | |
|---|---|---|---|---|
| The amount generated by replacing tyres ※1 | 76 | 79 | 78 | 78 |
| The amount generated from scrapped vehicles ※2 | 14 | 12 | 12 | 11 |
| Total | 90 | 91 | 90 | 89 |
Source: JATMA |
||||
Retreaded tyres are excluded because they do not become ELTs while in use and do not affect the amount of ELT generated nor effectively used. The figures in the table above do not include retreaded tyres. Other countries use a similar approach to organize their data.
(2) Effective utilization of ELTs
The amount of effectively utilized ELT in 2024 was 692,000 tons, with an effective utilization rate of 99.6%.
Trends in ELTs utilized effectively
Weight: kt
| 2021 | 2022 | 2023 | 2024 | |
|---|---|---|---|---|
| Paper mills | 425 | 433 | 476 | 413 |
| Chemical plants | 112 | 136 | 113 | 104 |
| Cement plants | 73 | 81 | 67 | 60 |
| Small-sized boilers | 3 | 5 | 5 | 2 |
| Tyre manufacturers' plants | 2 | 3 | 2 | 1 |
| Pyrolysis facilities | 1 | 2 | 1 | 3 |
| Crumb rubber | 84 | 85 | 88 | 89 |
| Material recycling | 1 | 15 | 24 | 20 |
| Steel plants | 17 | 0 | 0 | 0 |
| Effective utilization amount | 718 | 760 | 776 | 692 |
| Amount of ineffective final disposal | 11 | 14 | 6 | 3 |
| Effective utilization rate | 98.5% | 98.2% | 99.2% | 99.6% |
Source: JATMA |
||||
(3) Others
- The effective utilization rate is calculated as "effectively utilized amount" / "effectively utilized amount + ineffectively utilized final disposal amount" × 100.
- For the purpose of calculating the domestic effective utilization rate, this calculation does not include exports of ELTs, and exports of cut/shredded ELTs, and imports cut/shredded ELTs.
- The annual import weight of cut/shredded ELT in 2024 was approximately 170,240 tons.This represents an increase of about 30,000 tons compared to the previous year, marking the highest level since data collection began. Domestic energy recovery facilities for ELT continue to purchase cut/shredded ELT from overseas, and this trend remains unchanged.
2. Status of Illegal Dumping of ELTs
At the time of investigation in February 2025, there were 79 cases and 23,880 tons of illegal dumping of ELTs in Japan.
Transition of illegal dumping(Remaining cases)
Weight: tons
| 2024 | 2025 | ||||
|---|---|---|---|---|---|
| Case | Weight | Case | Weight | Year-on-year change | |
| Case | Weight | ||||
| 75 | 23,765 |
79 | 23,880 |
4 | 115 |
Source: JATMA |
|||||
Trend of illegal dumping
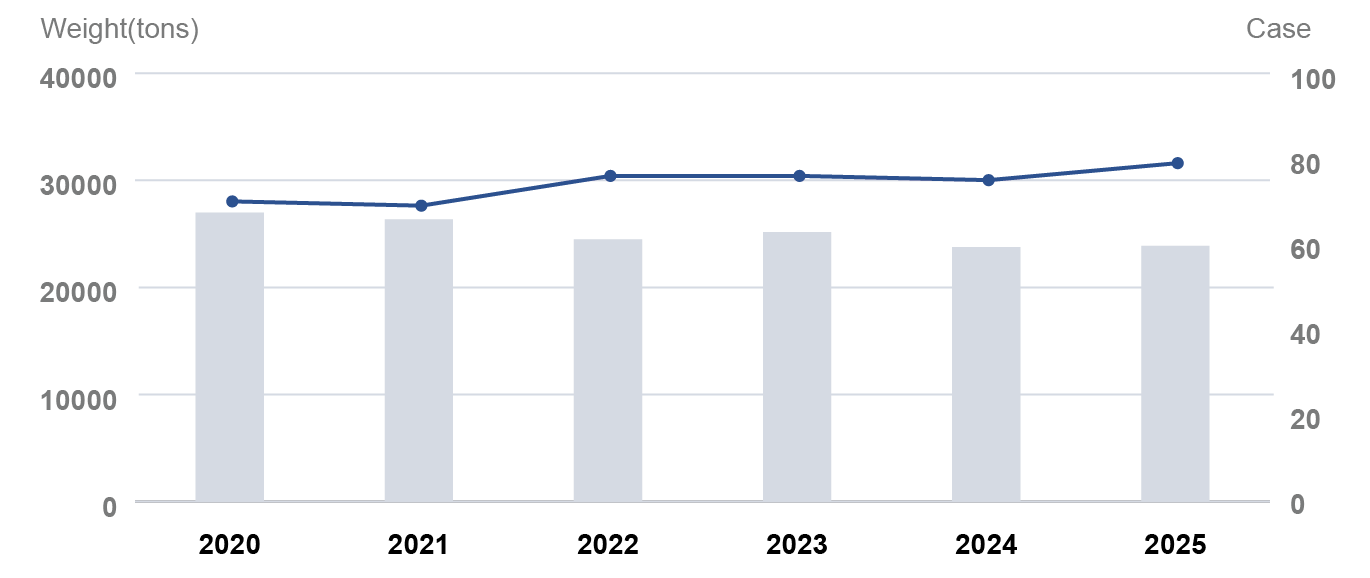
| 2020 | 2021 | 2022 | 2023 | 2024 | 2025 | |
|---|---|---|---|---|---|---|
| Illegal dumping | 26,991 | 26,363 | 24,499 | 25,163 | 23,765 | 23,880 |
| Case | 70 | 69 | 76 | 76 | 75 | 79 |
Source: JATMA |
||||||
3. JATMA Support Program
To reduce illegal dumping of ELTs, JATMA has been operating a restoration support system since 2005.
In the total of 20 years, from 2005 to 2024, JATMA supported 379.26 million yen for 23 cases, and removed 2,993,013 tyres /30,117 tons of ELTs.
【Reference】Effort to Reduce
In order to promote longer lasting and lighter tyres, we publish the "Reduction Achievement Rate" calculated from the life index and weight index of the new product compared to the old product every year.
A reduction achievement rate above 100 indicates improvement, and below 100 indicates deterioration.
- Reduction Achievement Rate = Reduction Coefficient × 100
- Reduction Coefficient = Life Index / Weight Index
- Life index = (Wear life of new product based on design specification (km) / Wear life of old product based on design specification (km)) × 100
- Weight index = (weight of new product (kg) / weight of old product (kg)) × 100
In recent years, the performance required of tyres has become more diverse, such as reducing exterior noise, wet grip, rolling resistance, etc., and it is important to consider the balance between these, but by promoting longer life and lighter weight, we aim to reduce the amount of ELT generated and the amount of raw materials used.
Reduction achievement rate
| Category | Tyre Size | Classification | Reduction Achievement Rate | ||||
|---|---|---|---|---|---|---|---|
| 2020 | 2021 | 2022 | 2023 | 2024 | |||
| Passenger car tyres | 155/65R13 | Summer tyres | - | 96 | 106 | - | 102 |
| Studless tyres | 85 | 98 | - | - | 98 | ||
| Passenger car tyres | 175/65R14 | Summer tyres | - | 98 | 108 | - | 106 |
| Studless tyres | 85 | 99 | 100 | - | 101 | ||
| Passenger car tyres | 195/65R15 | Summer tyres | - | 108 | 110 | 106 | 104 |
| Studless tyres | 95 | 100 | - | - | 97 | ||
| Passenger car tyres | 215/45R17 | Summer tyres | - | 118 | 115 | 108 | 99 |
| Studless tyres | 72 | 102 | - | - | 96 | ||
| Light truck tyres | 145R12 (145/80R12) |
Summer tyres | - | - | 100 | - | - |
| Studless tyres | - | 97 | 121 | - | 107 | ||
| Light truck tyres | 185R14 (185/80R14) |
Summer tyres | - | - | 98 | - | - |
| Studless tyres | - | 97 | - | - | 114 | ||
| Light truck tyres | 205/70R16 | Summer tyres | 115 | 133 | - | - | 132 |
| Studless tyres | 96 | - | 122 | 116 | 104 | ||
| Truck and bus tyres | 225/80R17.5 | Summer tyres | 100 | - | 113 | - | 113 |
| Studless tyres | - | 111 | 100 | 120 | - | ||
| Truck and bus tyres | 245/70R19.5 | Summer tyres | - | - | 113 | - | 110 |
| Studless tyres | - | 107 | 107 | 107 | - | ||
| Truck and bus tyres | 11R22.5 | Summer tyres | 100 | - | 141 | - | 117 |
| Studless tyres | 100 | 110 | 114 | 120 | - | ||
Note: 7.50R16 has been replaced by 245/70R19.5 since 2007. |
Source: JATMA | ||||||