Preventing Global Warming
1. LCA
(1) Tyre LCCO2 Calculation Guidelines
JATMA has prepared guidelines in order to present basic data and calculation examples that can be used to calculate LCCO2 from tyres.
In 1998, the Japan Rubber Manufacturers Association put together the first LCA guidelines for tyres, and these guidelines have been used for over 10 years since then. Partly because the guidelines no longer conformed to international standards, JATMA made major revisions to them in 2012 (Ver. 2.0).
Approximately ten years have passed since the issuance of Guidelines Ver. 2.0 and the circumstances of the automobile industry have changed. Because we thought that guidelines that make it possible to make calculations based on the current situation would be necessary in 2021, we made further revisions to develop the current Guidelines Ver.3.0. Guidelines Ver.3.0 reflect the latest inventory data and typical tyre data as well as, regarding calculations for the use stage that is responsible for 80% of GHG emissions in the entire tyre lifecycle, the setting conditions and results from the latest fuel consumption tests.
In addition, we entrusted the Japan Life Cycle Assessment Facilitation Centre with a review and the Centre has acknowledged that Guidelines Ver.3.0 conform to ISO14040:2006 and ISO14044:2006.
The Tyre LCCO2 Calculation Guidelines are available in two types: a limited disclosure version and a full disclosure version.
JATMA has concluded a special license agreement with the Sustainable Management Promotion Organization in Japan and these Guidelines include the GHG emission coefficients from inventory database IDEAv2. Consequently, JATMA can disclose these Guidelines to parties who want to make calculations according to them under the condition that the parties agree with the designated conditions. In exceptional cases, however, we disclose these Guidelines to parties who have an end user license of inventory database IDEAv2 as long as we can confirm that they possess a license.
You can download and view the limited disclosure version, which does not contain the emission coefficients from IDEA.
2. Calculation of CO2 emission reductions
(1) Reduction Effect of CO2 Emissions by Reducing Rolling Resistance of Passenger Car Tyres
① Introduction
When considering CO2 emissions throughout the entire life cycle of tyres (raw material procurement, production, distribution, usage, end of life and recycling), more than 80% of CO2 emissions is accounted in the usage stage. Reducing the tyre rolling resistance improves vehicle fuel efficiency, which can reduce CO2 emissions.
In 2010, the Japanese tyre industry started the tyre labeling system applicable to replacement summer tyres for passenger vehicles ahead of all other countries in the world. General users can select fuel-efficient tyres1 with low rolling resistance while referring to the grades shown on the labels when they purchase tyres.
Tyres with lower rolling resistance have become more popular year by year thanks in part to this labeling system. JATMA conducted a survey to confirm the effect of reducing CO2 emissions through the widespread use of tyres with lower rolling resistance and published the results in 2015 and 2018. CO2 emissions were calculated for 2006, 2012 and 2016, before and after the labeling system started.
After that, we determined to conduct this kind of survey once every four years considering the product life cycle and other factors. This time, we summarized the CO2 emission reduction effect as a result of a survey of CO2 emissions in 2020.
Note 1:
Tyres for which the rolling resistance performance is classified as A or higher and for which the wet grip performance is classified as a, b, c or d
(Refer to https://www.jatma.or.jp/english/environment_recycle/aboutlabelingsystem.html)
② Status of reducing tyre rolling resistance coefficients
Fig. 1 shows the rolling resistance coefficients of tyres that the member companies sold in Japan.
The charts show the ratios of the numbers of tyres sold according to the grading in the labeling system (Table 1).
The ratio of tyres classified as A or higher (tyres with rolling resistance coefficients applicable to fuel-efficient tyres) accounted for 29.7% of total sales in 2006; the ratio increased to 54.7% in 2012, 76.9% in 2016 and 77.8% in 2020. Thus, the sales ratio of tyres with lower rolling resistance has been continuously increasing. The ratio of tyres classified as AA or higher was 3.8% of total sales in 2006; it increased to 9.7% in 2012, 28.5% in 2016 and 38.3% in 2020.
Table 2 shows the average values weighted by the number of sold tyres for each tyre rolling resistance coefficient (RRC) level. The value in 2020 decreased by 0.2 N/kN (2.4%) from that in 2016 and decreased by 1.56 N/kN (15.9%) from that in 2006. Thus, the weighted average RRC has been continuously decreasing.
Note:
This survey targeted original equipment tyres and winter tyres that are not covered in the labeling system to evaluate CO2 emissions of all types of passenger car tyres.
Table 1 Tyre rolling resistance coefficients (RRCs) and classifications in the labeling system
| RRC Unit:N/kN |
Classification under JATMA labeling system | |
|---|---|---|
| RRC≦6.5 | AAA | Fuel Efficient tyres |
| 6.6≦RRC≦7.7 | AA | |
| 7.8≦RRC≦9.0 | A | |
| 9.1≦RRC≦10.5 | B | ― |
| 10.6≦RRC≦12.0 | C | |
| 12.1≦RRC | (Lower than C) | |
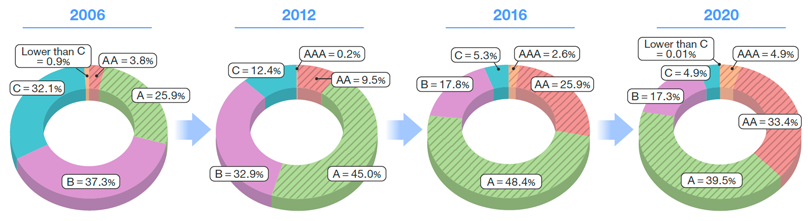
Fig.1 Ratios of the numbers of tyres sold by grade (tyres manufactured by JATMA member companies sold in Japan)
Table 2 Weighted average RRC (N/kN)
| 2006 | 2012 | 2016 | 2020 |
| 9.80 | 9.06 | 8.44 | 8.24 |
③ The Reduction effect of CO2 emissions when tyres are in use
Based on Tyre LCCO2 Calculation Guidelines Ver. 3.02 issued by JATMA, CO2 emissions per tyre when tyres are in use3 were calculated from the rolling resistance values in Table 2. The value in 2020 was 196.6 kg/tyre. The CO2 emissions decreased by 4.8 kg (2.4%) from those in 2016 and by 37.2 kg (15.9%) from those in 2006 (Fig. 2).
Note 2:
(https://www.jatma.or.jp/environment_recycle/globalwarming.html)
In this survey, the emissions in the past fiscal years were calculated based on the new guidelines (revised in March 2021), so the values differ from those published in the past.
Note 3:
Emissions throughout the entire service life of a single tyre. The calculation conditions (e.g., fuel economy and tyres’ contribution to fuel consumption) are not the average market values. They are the values measured on the vehicle in JATMA test and values calculated with those.
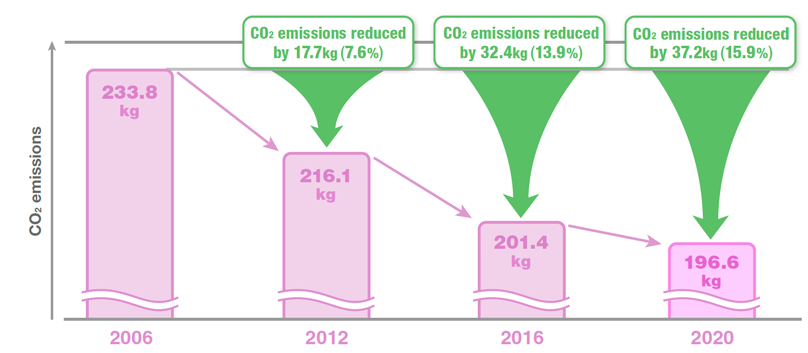
Fig.2 CO2 emissions when tyres are in use (per tyre)
Since it is difficult to accurately determine the amount of CO2 emissions during tyre use in a year, the total amount of CO2 emitted by the end of service life of the tyres sold in the year is used as an alternative indicator for comparison. The CO2 emissions in Fig.2 is multiplied by the number of tyres sold in each year to calculate the total CO2 emissions in the Japanese market.
CO2 emissions in 2020 were reduced by 2.825 million tons compared to 2006 as the effect of rolling resistance reduction (Fig. 3).
Although CO2 emissions per tyre have been continuously decreasing, CO2 emissions reduction in the Japanese market is moderate because the number of tyres sold in 2020 is 11.22 million less than in 2016 partly due to the impact of COVID-19.
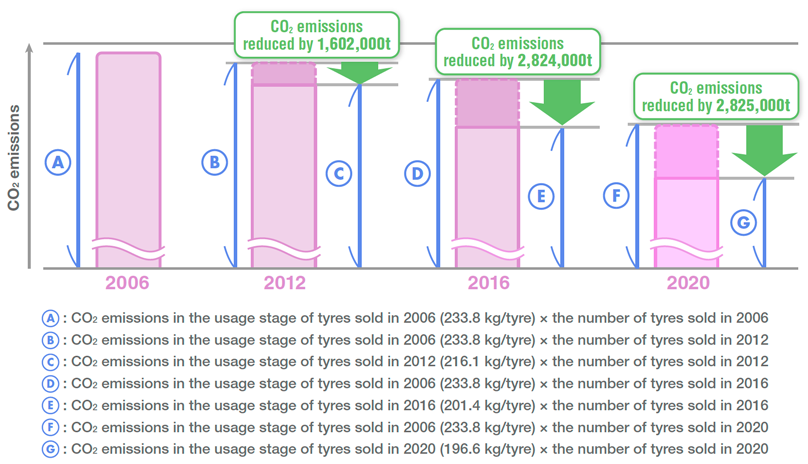
Fig.3 Reduction of CO2 emissions when tyres are in use
(2) Effects on resource usage saving and CO2 emissions reduction through the spread of retread tyres for trucks and buses
① Introduction
The tyre industry has been working to save energy and reduce CO2 emissions throughout the entire life cycle of tyres. In addition, JATMA revised the Tyre LCCO2 Calculation Guidelines and released Ver. 3.0 in March 2021 to help calculate such activities’ effects.
JATMA used these guidelines to calculate resources saved and CO2 emissions reduced through the spread of retread tyres for trucks and buses1 in the Japanese market and released the results in December 2022.
This time, JATMA surveyed the sales of new and retread tyres in 2024 and summarized the resource savings and CO2 emission reductions based on the research results.
For this estimation, the data on the actual sales in the Japanese market for each fiscal year was provided by Japan Retreaders’ Association, as in the previous estimations.
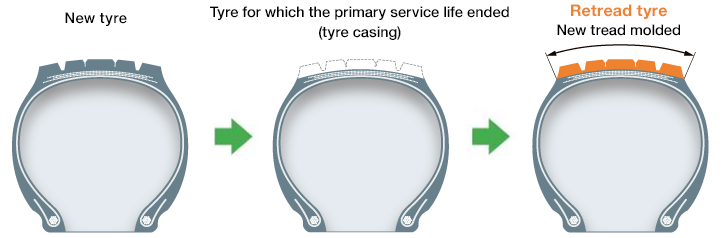
Fig.1 Cross-section image of retread tyre
(Cited from Japan Retreaders’ Association’s website: https://www.retread.jp/retread-tire/)
② Spread of retread tyres
Table 1 and Figure 2 show the retreading rates in the Japanese market. Although the retreading rates remained at approximately 18% from 2018 to 2022, the rate reached 20% in 2023. 2024's rate was at the same level as 2023's, at 19.9%.
Table 1 Retreading rates in the Japanese market
| 2018 | 2019 | 2020 | 2021 | 2022 | 2023 | 2024 | ||
| The number of tyres sold in Japan (Ten thousand pieces) |
Total | 671.4 | 665.9 | 599.4 | 648.0 | 679.4 | 637.9 | 630.9 |
| New | 550.6 | 545.8 | 489.4 | 532.2 | 556.9 | 510.6 | 505.6 | |
| Retread 2 | 120.8 | 120.1 | 110.1 | 115.8 | 122.5 | 127.3 | 125.3 | |
| Retreading rate3 (%) | 18.0 | 18.0 | 18.4 | 17.9 | 18.0 | 20.0 | 19.9 | |
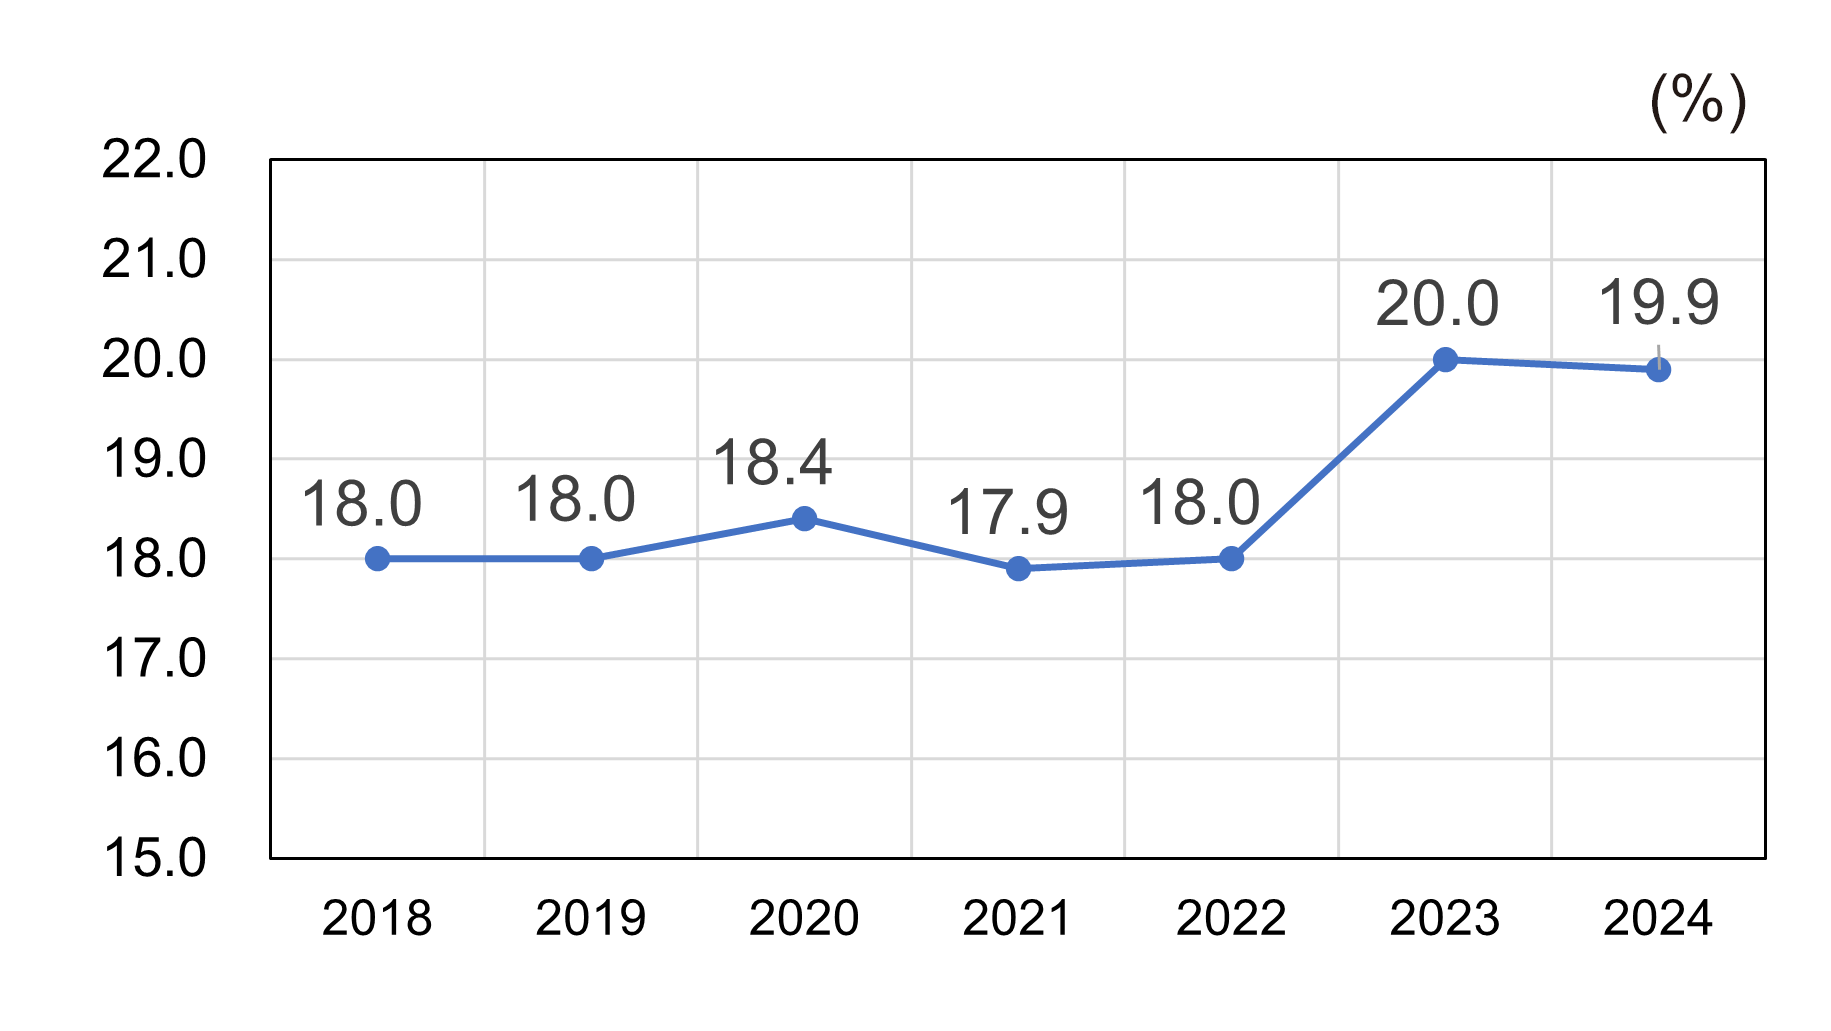
Fig. 2 Retreading rate in the Japanese market
③ Calculating resources saved through the spread of retread tyres
In retread tyre production, since the tyre casing is reused, the only new input material is tread rubber. Comparing it to new tyre production, the resource usage can be reduced by approximately 69% and the CO2 emissions can be reduced by approximately 65% (calculated for the representative size of 275/80R22.5 in the Tyre LCCO2 Calculation Guidelines).
Fig. 3 shows the calculated resources saved from 2018 to 2024 in the entire Japanese market.
These reductions were calculated by comparing to a case where all tyres sold were assumed to be new tyres, and they are proportional to the number of retread tyres sold.
The resources saved in 2020 and 2021 were lower due to the strong impact of the spread of COVID-19; the amount recovered after that and, since 2022, the amount of resources saved has surpassed that before the spread of COVID-19, remaining steady. The resources saved in 2024 were approximately 48,000 tons per year. This is equivalent to approximately 870,000 tyres when converted using an average weight of new tyres in the size of 275/80R22.5.
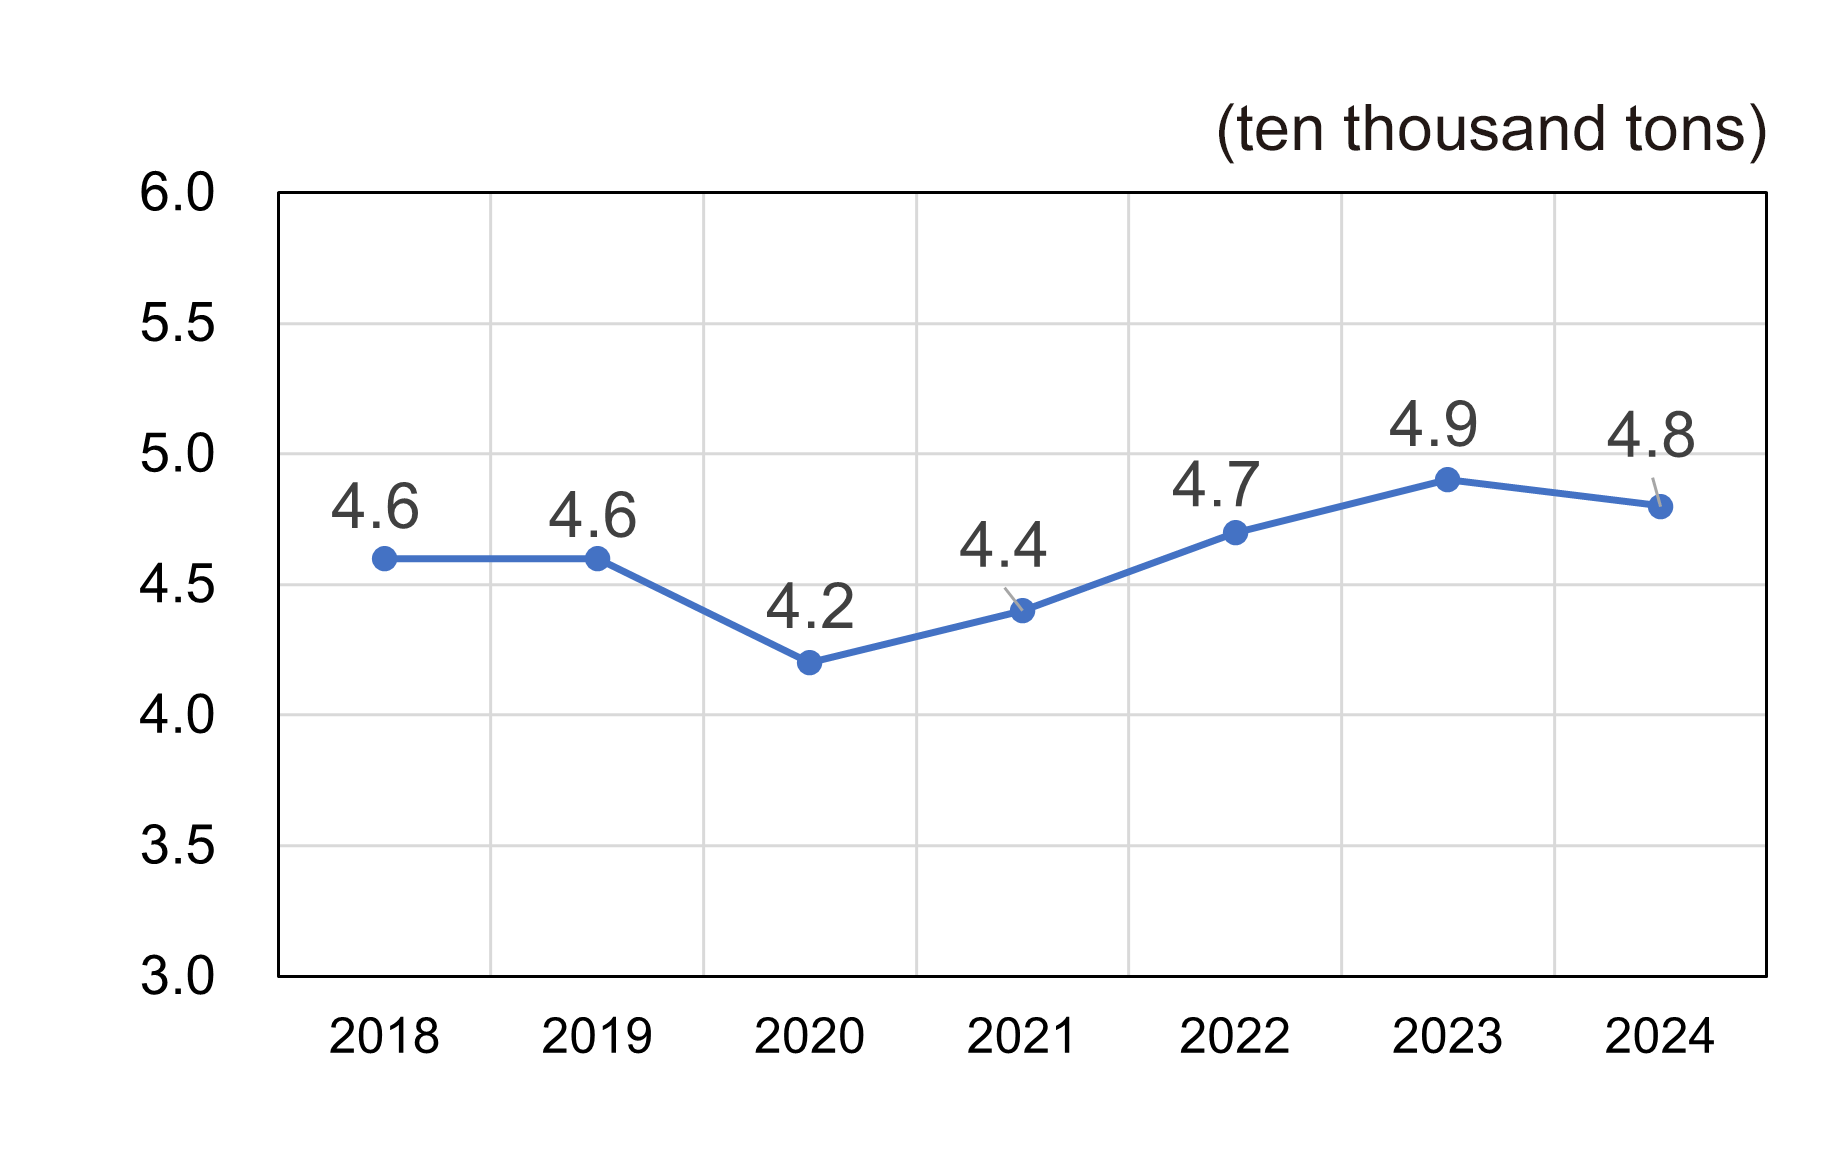
Fig. 3 Resources saved in the Japanese market
④ Calculating CO2 emissions reduced through spread of retread tyres
Table 2 lists the CO2 emissions reduced at each stage of the life cycle in the Japanese market from 2018 to 2024 compared to a case where all the sold tyres were assumed to be new tyres. Fig. 4 shows the CO2 emissions reduced for the period.
The amount of the CO2 emissions reduced in 2024 was 217,000 tons. This amount was slightly lower than 2023, partly because the total number of tyres sold in Japan in 2024 slightly decreased.
This is equivalent to the CO2 emissions released when approximately 1,190,000 new tyres in the size of 275/80R22.5 are produced.
Table 2 CO2 emissions reduced in the Japanese market
| Reduced CO2 emissions (ten thousand tons) | 2018 | 2019 | 2020 | 2021 | 2022 | 2023 | 2024 |
| Raw material production stage | 11.5 | 11.4 | 10.5 | 11.0 | 11.6 | 12.1 | 11.9 |
| Raw material transportation stage | 0.8 | 0.8 | 0.7 | 0.7 | 0.8 | 0.8 | 0.8 |
| Tyre production stage | 2.0 | 2.0 | 1.8 | 1.9 | 2.0 | 2.1 | 2.0 |
| End of life and recycling stage | 6.7 | 6.7 | 6.1 | 6.5 | 6.8 | 7.1 | 7.0 |
| Total | 20.9 | 20.8 | 19.1 | 20.1 | 21.2 | 22.1 | 21.7 |
CO2 emissions reduction effects in each stage were calculated as follows.
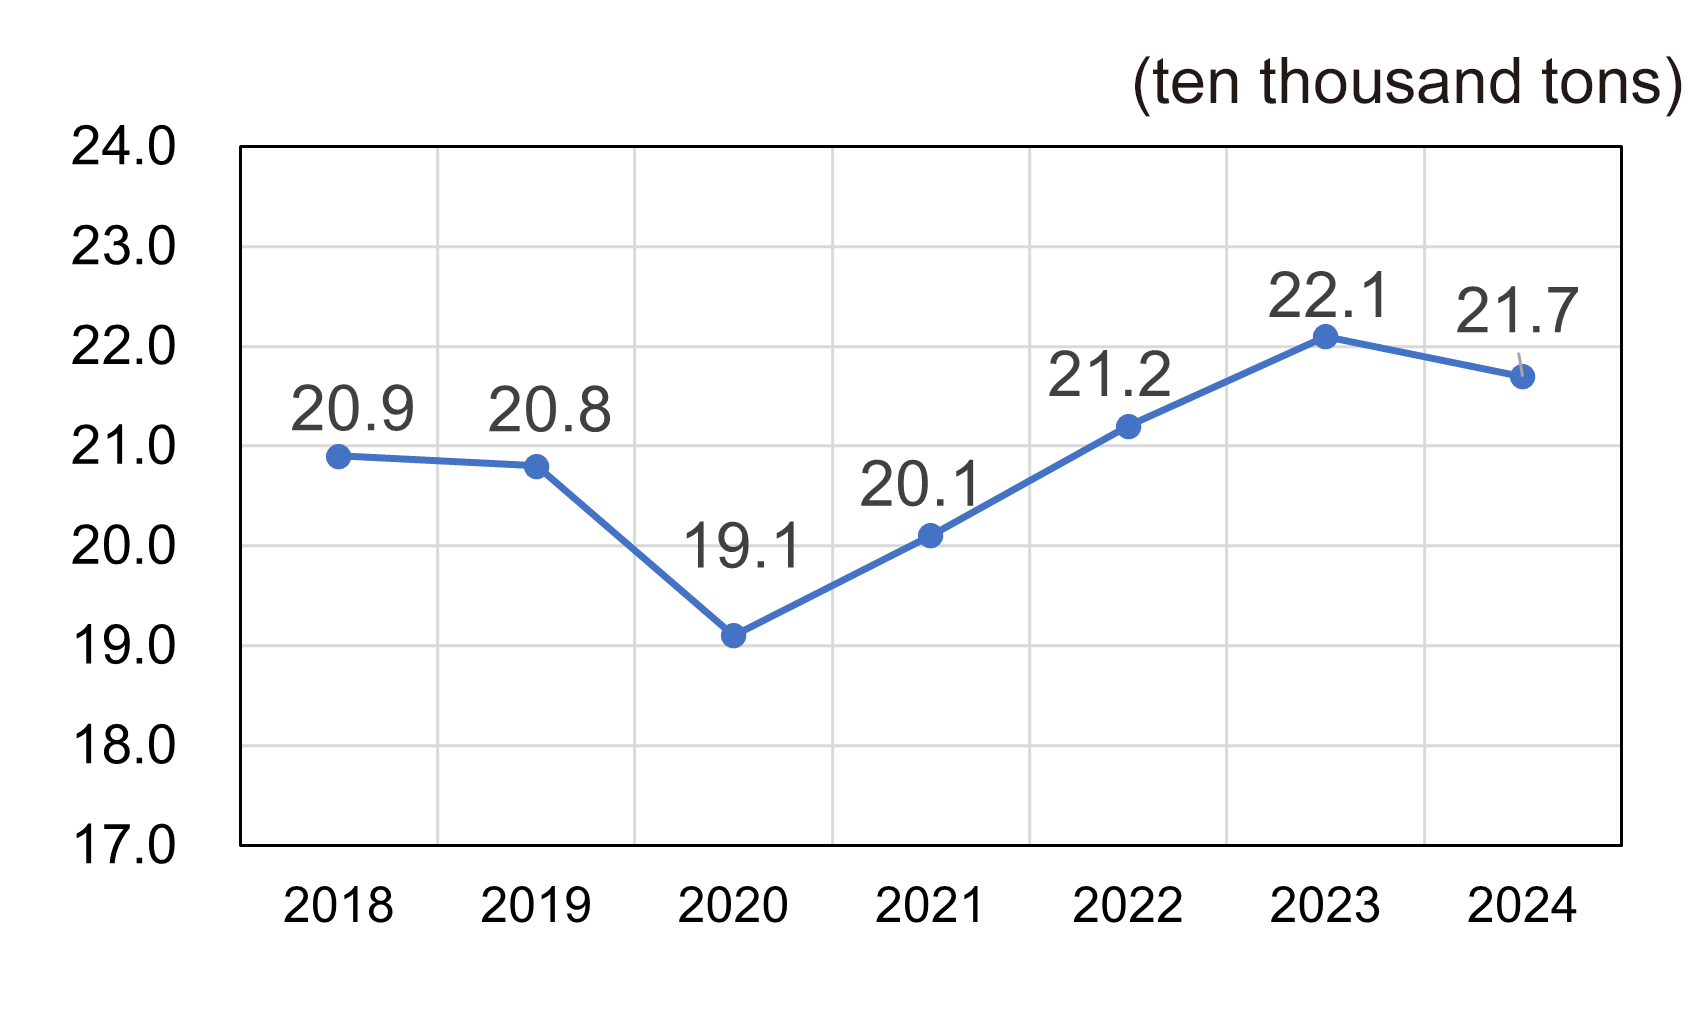
Fig. 4 CO2 emissions reduced in the Japanese market
Fig. 5 shows the relationship between the retreading rate and reduced CO2 emissions when using the total number of tyres in 2024 as a precondition.
They are in the proportional relationship, and if the use of retread tyres increases in the Japanese market, the contributions to reducing CO2 emissions and resource usage will further increase.
Because the current retreading rate in Japan is lower than those in other countries,4 it's expected increasing the retreading rate would further contribute to realizing a sustainable society.
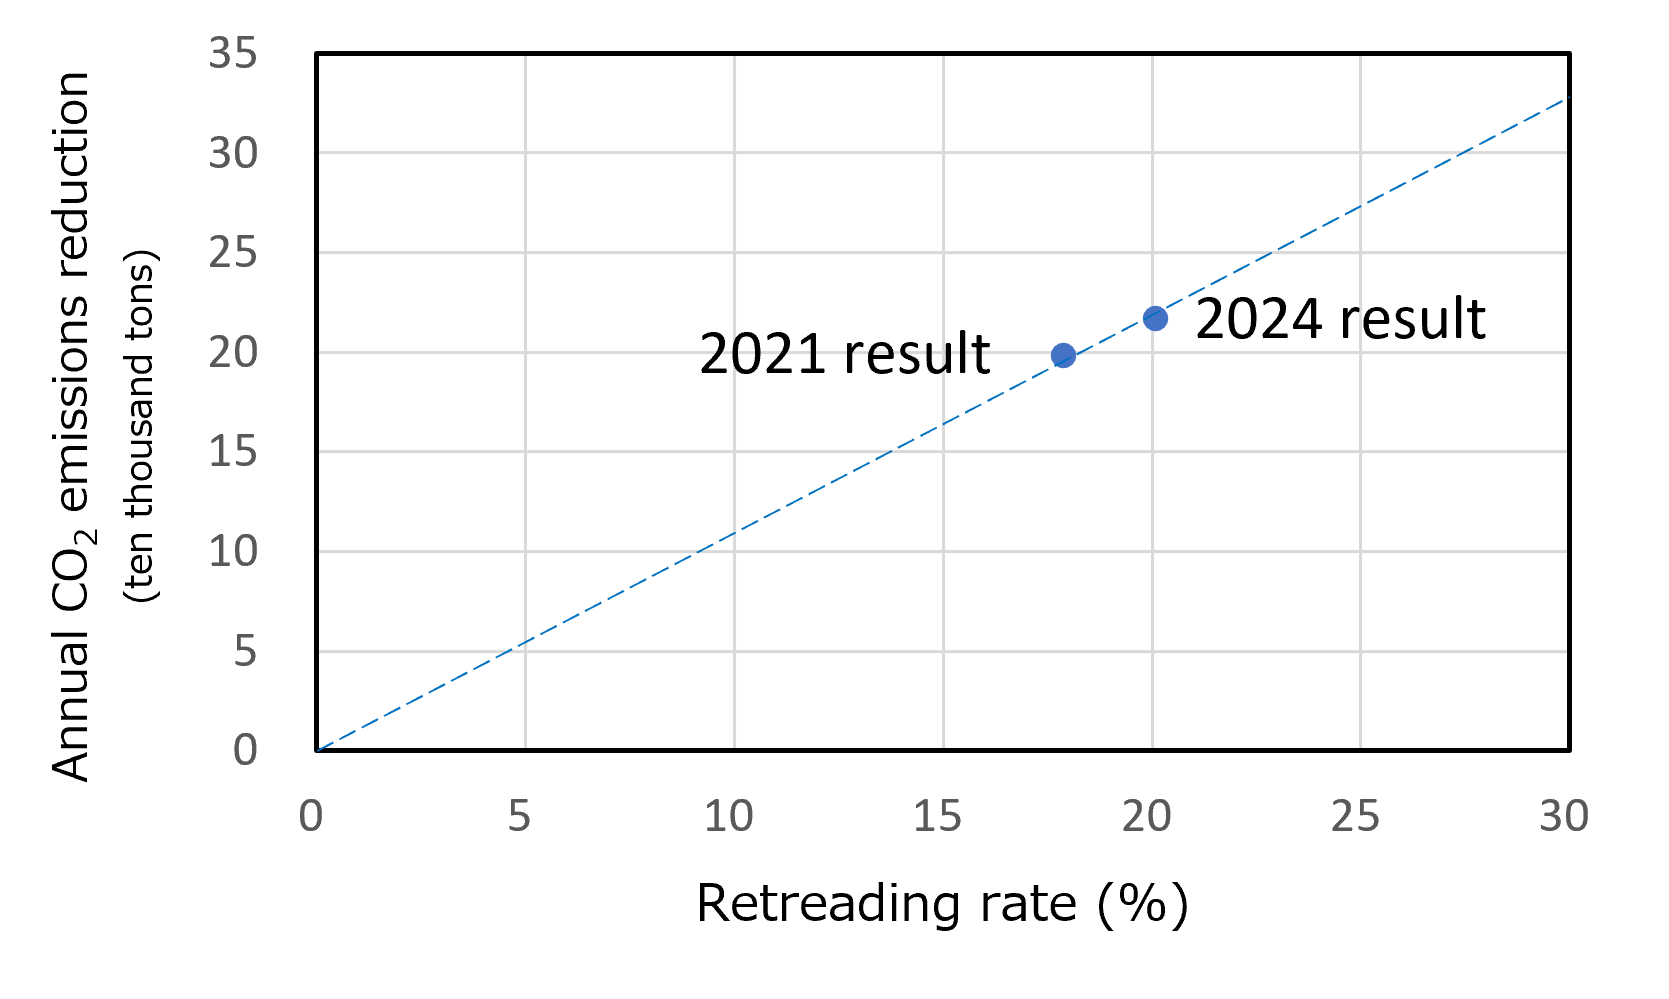
Fig. 5 Relationship between the retreading rate and reduced CO2 emissions