Changes in Production Volume
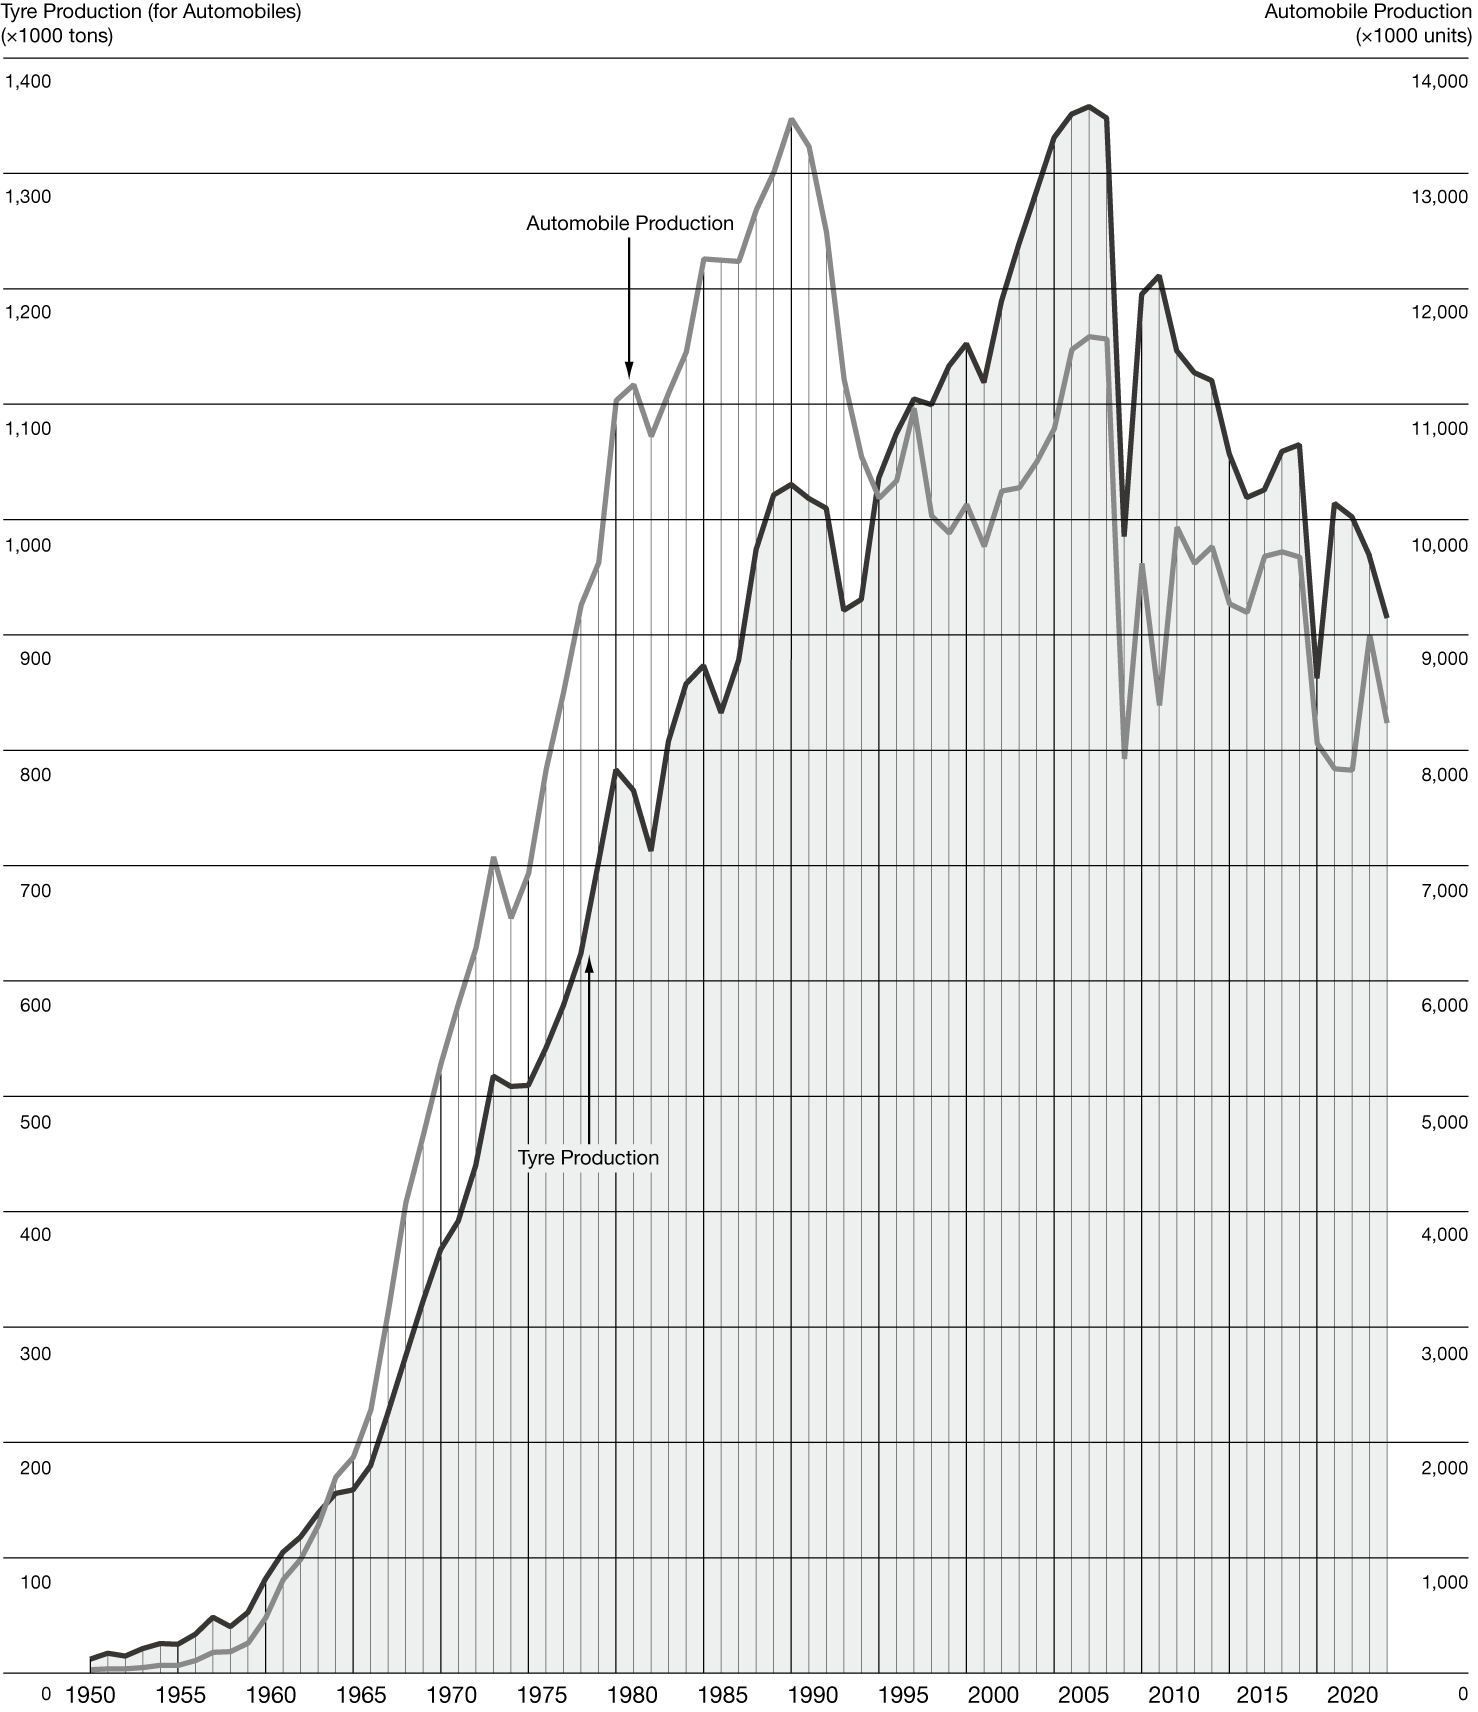
Changes in Production Volume of Tyres and Automobiles
| 1950 | 1960 | 1970 | 1980 | 1990 | 2000 | 2010 | 2015 | 2016 | 2017 | 2018 | 2019 | 2020 | 2021 | 2022 | 2023 | 2024 | |
|---|---|---|---|---|---|---|---|---|---|---|---|---|---|---|---|---|---|
| Tyre Production (for Automobiles) (×1000 tons)(quantity of rubber) |
14 | 83 | 369 | 784 | 1,031 | 1,153 | 1,196 | 1,058 | 1,020 | 1,026 | 1,060 | 1,066 | 863 | 1,015 | 1,003 | 968 | 926 |
| Automobile Production (×1000 units) |
32 | 482 | 5,289 | 11,043 | 13,487 | 10,141 | 9,629 | 9,278 | 9,205 | 9,691 | 9,730 | 9,684 | 8,068 | 7,847 | 7,835 | 9,000 | 8,235 |
Source: JATMA
Changes in Production Volume of Tyres and Automobiles