1. Volume of ELT generated
In 2019 (January to December), the sum of ELT generated by replacing tyres and the quantity generated by scrapped vehicles in Japan was 96 million tyres and 1,026,000 tons by weight. Compared with the previous year, the number is the same and the weight is reduced by 6,000 tons.
(1) The amount generated by replacing tyres.
The amount of ELT generated by replacing tyres was 81 million in number and 884,000 tons in weight. Both the number and the weight decreased from the previous year.
(2) The amount generated by scrapped vehicles.
The amount of ELT generated by scrapped vehicles was 15 million in number and 142,000 tons in weight. Both the number and the weight slightly increased from the previous year.
2. Current status of the ELT recycling
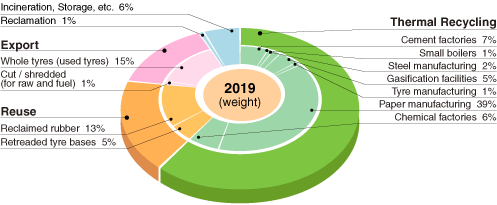
The amount of ELT recycled in 2019 was 966,000 tons, down 31,000 tons from the previous year. The recycling rate was 94%, down 3 points from the previous year.
In particular, the amount used at paper manufacturing decreased by 44,000 tons compared with the previous year. This is considered to be caused by a decrease in paper production due to the effects of the progressing paperless. In addition, the price when domestic thermal recycling users purchase cut / shredded has been on a downward trend in recent years due to competition with other waste-derived fuels.
3. Others
In recent years, domestic thermal recycling users have been importing purchase cut / shredded for value.
The annual import volume in 2019 was about 96,000 tons, an increase of about 6,000 tons from the previous year.
Although the recycling status on ELT published by JATMA is intended to grasp the processing status of ELT generated in Japan, so the import amount of ELT is not included in the total amount.

Source: JATMA
| 2017 | 2018 | 2019 | ||||||||||||
|---|---|---|---|---|---|---|---|---|---|---|---|---|---|---|
| tyres | weight | distribution (%) |
tyres | weight | distribution (%) |
tyres | weight | distribution (%) |
2019/2018 (%) |
|||||
| tyres | weight | tyres | weight | tyres | weight | tyres | weight | |||||||
| The amount generated by replacing tyres | 83 | 897 | 86 | 87 | 82 | 892 | 85 | 86 | 81 | 884 | 84 | 86 | 99 | 99 |
| The amount generated by scrapped vehicles | 14 | 137 | 14 | 13 | 14 | 140 | 15 | 14 | 15 | 142 | 16 | 14 | 107 | 101 |
| Total | 97 | 1,034 | 100 | 100 | 96 | 1,032 | 100 | 100 | 96 | 1,026 | 100 | 100 | 100 | 99 |
Source: JATMA
| 2017 | 2018 | 2019 | ||||||||
|---|---|---|---|---|---|---|---|---|---|---|
| weight | distri- bution (%) |
weight | distri- bution (%) |
weight | distri- bution (%) |
2019/ 2018 (%) |
||||
| Kind of re- cycling |
Do- mes- tic |
Reuse | Retreaded tyre bases |
54 | 5 | 51 | 5 | 51 | 5 | 100 |
| Reclaimed rubber |
118 | 11 | 120 | 12 | 132 | 13 | 110 | |||
| Other reuse | 6 | 1 | 1 | 1 | 0 | 0 | – | |||
| Subtotal (A) | 178 | 17 | 172 | 17 | 183 | 18 | 106 | |||
| Ther- mal Recy- cling |
Paper manu- facturing |
436 | 42 | 446 | 43 | 402 | 39 | 90 | ||
| Chemical factories |
47 | 5 | 66 | 6 | 66 | 6 | 100 | |||
| Cement factories |
70 | 7 | 64 | 6 | 70 | 7 | 109 | |||
| Steel manu- facturing |
17 | 2 | 14 | 1 | 18 | 2 | 129 | |||
| Gasification facilities |
58 | 6 | 61 | 6 | 56 | 5 | 92 | |||
| Tyre manu- facturing |
21 | 2 | 20 | 2 | 9 | 1 | 45 | |||
| Small boilers | 3 | 1 | 3 | 1 | 2 | 1 | 67 | |||
| Subtotal (B) | 652 | 63 | 674 | 65 | 623 | 61 | 92 | |||
| Abroad | Ex- port |
Whole tyres (used tyres) |
131 | 13 | 148 | 14 | 158 | 15 | 107 | |
| Cut / shredded (for raw and fuel) |
4 | 1 | 3 | 1 | 2 | 1 | 67 | |||
| Subtotal (C) | 135 | 13 | 151 | 15 | 160 | 16 | 106 | |||
| Total recycling (A+B+C) | 965 | 93 | 997 | 97 | 966 | 94 | 97 | |||
| Reclamation | 1 | 1 | 1 | 1 | 1 | 1 | 100 | |||
| Incineration, Storage, etc. | 68 | 7 | 34 | 3 | 59 | 6 | 174 | |||
| Subtotal(D) | 69 | 7 | 35 | 3 | 60 | 6 | 171 | |||
| Total(A+B+C+D) | 1,034 | 100 | 1,032 | 100 | 1,026 | 100 | 99 | |||
Source: JATMA
N.B.: There can be some cases that distribution's subtotals and the sums of their constituent items don't match due to the handling of decimals.

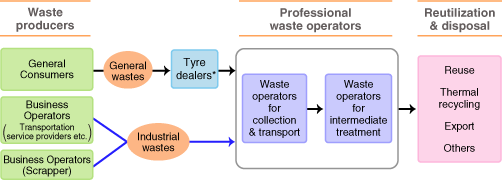
*Any tyre sellers such as tyre retailers, tyre shops, auto-supply shops, gas stations, car dealers, car repair shops, and so on.


